

What if your heartbeat’s tiny timing shifts tell you more about your health than your average beats-per-minute?
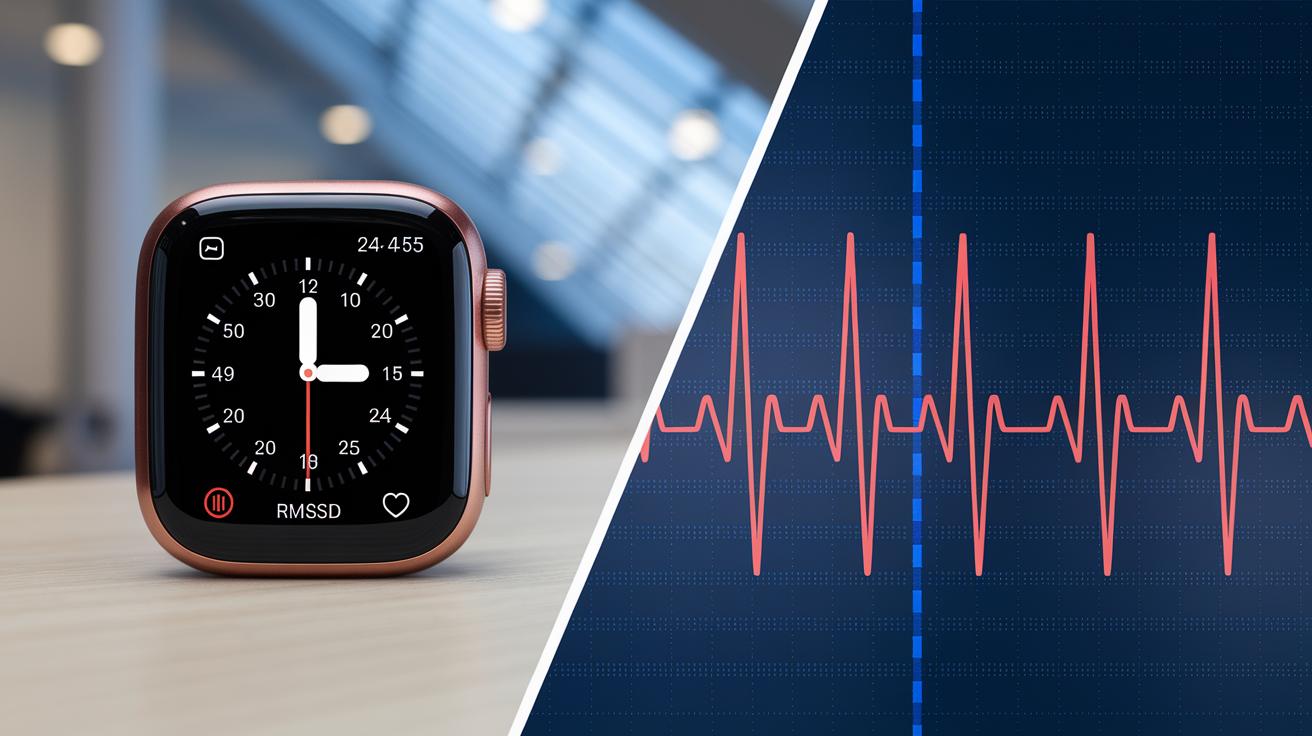
Heart rate variability (HRV) measures the millisecond differences between consecutive heartbeats, not your pulse rate.
It’s a direct window into your autonomic nervous system—how well your body switches between fight-or-flight and rest-and-recover.
Higher variability often means better resilience; lower variability can flag stress, illness, or poor recovery before you feel it.
This post explains what HRV actually measures, why it matters, and simple steps you can try today to track and improve it.
Core Physiology Behind What HRV Measures

Heart rate variability measures the millisecond-level changes in time between consecutive heartbeats. Your heart doesn’t beat like a metronome. It naturally fluctuates beat to beat, sometimes by just a few milliseconds, sometimes by tens or hundreds. These tiny timing shifts are measured as inter-beat intervals (IBI) or normal-to-normal intervals (NN intervals) and expressed in milliseconds (ms), not as an average beats-per-minute number. HRV captures this real-time variation in timing, which reflects how your autonomic nervous system is modulating your heart’s intrinsic pacemaker, the sinoatrial (SA) node.
The autonomic nervous system has two branches that constantly adjust your heart rhythm in response to internal and external demands. The sympathetic system (fight-or-flight) reduces beat-to-beat variability by speeding the heart and making the rhythm more regular. Less flexible. The parasympathetic system (rest-and-digest, driven largely by the vagus nerve) increases variability by slowing the heart and allowing more moment-to-moment fluctuation. When your body is under stress, ill, or in high-intensity exercise, sympathetic dominance tightens the rhythm and HRV drops. When you’re resting, sleeping, or recovering, parasympathetic tone rises and HRV increases.
HRV is fundamentally a marker of autonomic flexibility, not heart rate itself. You can have the same average heart rate (say, 60 beats per minute) with either high variability (flexible autonomic control) or low variability (rigid autonomic control). The variation reflects how well your nervous system can adapt and respond, second by second, to changing demands.
Key physiological drivers that directly influence HRV:
- Respiration: Respiratory sinus arrhythmia causes intervals to lengthen on exhalation (vagal activation) and shorten on inhalation.
- Vagal tone: Higher parasympathetic (vagus nerve) activity increases beat-to-beat variability.
- Stress response: Sympathetic activation from stress, exercise, or illness decreases variability.
- Intrinsic pacemaker modulation: The SA node’s baseline ~100 bpm rate is continuously adjusted by the autonomic nervous system.
HRV and Autonomic Nervous System Balance Interpretation

Higher HRV generally signals stronger parasympathetic influence and greater physiological resilience. When your body can afford to let the heart rhythm vary widely, it means your nervous system isn’t locked into fight-or-flight mode. During deep sleep, meditation, or quiet rest, HRV typically rises as vagal tone dominates. This flexibility is associated with better cardiovascular fitness, faster recovery from stress, and lower risk of adverse health outcomes in population studies. Lower HRV reflects sympathetic dominance, which can be situational (during exercise or acute stress) or chronic (from illness, poor sleep, overtraining, or sustained psychological stress). A drop in HRV is often an early indicator of physiological strain, sometimes appearing before resting heart rate changes or subjective symptoms become obvious.
HRV naturally fluctuates in predictable patterns throughout the day and in response to activity. During intense exercise, HRV can drop to near zero as the sympathetic system takes full control to support the physical demand. After exercise, HRV rebounds as the body shifts back into recovery mode. Illness, dehydration, alcohol consumption, or a late heavy meal can all suppress HRV for hours. A good night’s sleep, controlled breathing, or relaxation practices can elevate HRV measurably.
Common real-world situations that predictably affect HRV:
- Sleep: HRV increases during deep and REM sleep as parasympathetic activity rises.
- Exercise: HRV drops sharply during activity, especially high-intensity efforts, and recovers afterward.
- Stress or anxiety: Acute psychological stress activates sympathetic pathways and lowers HRV.
- Illness or inflammation: Infection or immune response reduces HRV before other symptoms may be obvious.
- Relaxation or meditation: Slow breathing and mindfulness practices acutely raise HRV by increasing vagal tone.
Time-Domain HRV Metrics and What They Measure

Time-domain metrics analyze the raw timing data (NN intervals in milliseconds) to quantify how much variability exists over a given recording period. The two most common time-domain metrics are RMSSD and SDNN, each reflecting different aspects of autonomic control. RMSSD (root mean square of successive differences) focuses on short-term, beat-to-beat changes and is especially sensitive to parasympathetic activity. It’s calculated as the square root of the mean of the squared differences between consecutive NN intervals: RMSSD = sqrt(mean[(NNi+1 − NNi)2]). Because it looks at rapid, successive changes, RMSSD captures vagal modulation and is less influenced by slower trends or circadian rhythms. Typical short-term RMSSD values in adults range from roughly 15 to 70 milliseconds, though individual baselines vary widely.
SDNN (standard deviation of NN intervals) measures overall variability across the entire recording and reflects the combined influence of both sympathetic and parasympathetic branches. SDNN is highly dependent on recording duration. A five-minute SDNN will be lower than a 24-hour SDNN because longer recordings capture additional sources of variability, including circadian cycles, activity patterns, and sleep-wake transitions. For 24-hour recordings, SDNN values often fall in the range of 50 to 100 milliseconds in healthy adults, but again, age, fitness, and individual physiology create wide ranges.
pNN50 is another time-domain metric, representing the percentage of successive NN intervals that differ by more than 50 milliseconds. It’s another marker of parasympathetic activity and short-term variability, though it’s less commonly reported in consumer devices than RMSSD or SDNN. Higher pNN50 indicates more frequent large beat-to-beat changes, typically associated with good vagal tone.
| Metric | What It Reflects | Typical Use |
|---|---|---|
| RMSSD | Short-term parasympathetic (vagal) activity | 1–5 minute recordings; daily recovery tracking |
| SDNN | Overall variability; sympathetic and parasympathetic combined | 24-hour recordings; long-term health assessment |
| pNN50 | Proportion of large successive differences; parasympathetic tone | Short-term recordings; research and clinical analysis |
Frequency-Domain HRV Parameters and Autonomic Insights

Frequency-domain analysis splits HRV data into different oscillation bands to identify patterns that correspond to autonomic inputs. The two primary bands are low frequency (LF, roughly 0.04–0.15 Hz) and high frequency (HF, roughly 0.15–0.4 Hz). HF power is tightly linked to parasympathetic activity and respiratory sinus arrhythmia. When you breathe slowly and deeply, HF power increases because vagal modulation of heart rate is synchronized with the breathing cycle. LF power is more complex and reflects a mix of both sympathetic and parasympathetic influences, along with baroreflex activity (blood pressure regulation). The LF/HF ratio is sometimes used as an index of sympathovagal balance, with a higher ratio suggesting greater sympathetic relative to parasympathetic influence, though this interpretation has important limitations.
Frequency-domain metrics are less intuitive than time-domain measures and are more sensitive to measurement conditions, breathing patterns, and analysis methods. They’re most useful in controlled research settings or clinical assessments where breathing rate and posture are standardized. For everyday tracking, time-domain metrics like RMSSD are more practical and reliable.
Limitations of frequency-domain interpretation:
- LF power isn’t a pure marker of sympathetic activity; it includes parasympathetic and baroreflex components.
- HF power is strongly influenced by breathing rate; slower or irregular breathing distorts the measurement.
- LF/HF ratio oversimplifies autonomic balance and can be misleading without context.
- Frequency analysis requires longer, artifact-free recordings and consistent measurement protocols.
HRV Measurement Methods and Device Accuracy

The gold standard for HRV measurement is electrocardiography (ECG), which directly detects the electrical R-wave peaks that mark each heartbeat. Clinical ECG and chest-strap heart rate monitors can capture R-R intervals with millisecond precision (often 1 ms resolution at 1000 Hz sampling), making them ideal for accurate HRV analysis. Chest-strap monitors that use ECG electrodes are widely used in research, clinical settings, and by athletes because they provide reliable, high-resolution data even during movement. Some chest devices also record three-dimensional acceleration alongside RR intervals, enabling advanced analysis of physical activity and autonomic response together.
Wrist-based wearables and fitness trackers use photoplethysmography (PPG), an optical sensor that detects blood volume changes in capillaries under the skin to estimate heartbeats. PPG-derived inter-beat intervals (IBI) are less accurate than ECG R-R intervals because the optical signal is affected by motion artifacts, skin tone, sensor placement, poor perfusion, and proprietary filtering algorithms. While many wrist devices report HRV metrics, their absolute values and day-to-day consistency can differ significantly from ECG-based measurements. Finger and ring-based PPG sensors often perform better than wrist sensors due to better signal quality, but they still don’t match ECG precision.
Smartphone apps that use the phone’s camera flash and lens to measure PPG from a fingertip can provide useful HRV snapshots under controlled conditions (still, seated, consistent lighting). These measurements are short (typically 1–3 minutes), highly sensitive to technique, and not suitable for long-term or ambulatory monitoring. For serious training, clinical assessment, or research, ECG-based measurement remains the preferred method.
Pros and cons of each measurement method:
- Clinical ECG: High accuracy, comprehensive data, multi-lead recording; requires medical setting, not practical for daily use.
- Chest-strap ECG monitor: Very high accuracy (~1 ms), suitable for research and athlete monitoring; requires chest placement, can be uncomfortable during long wear.
- Wrist PPG wearable: Convenient, continuous wear, integrates with activity/sleep tracking; lower accuracy, affected by movement and perfusion, algorithm variability across brands.
- Ring PPG sensor: Better signal quality than wrist, comfortable for overnight wear; still PPG-based limitations, device-specific algorithms, more expensive.
- Smartphone PPG app: Accessible, no extra device needed, useful for quick checks; short recordings only, highly technique-dependent, not for continuous monitoring.
Short-Term vs 24-Hour HRV Measurements
Short-term HRV recordings, typically lasting 1 to 5 minutes, are the most common format for daily tracking and recovery assessment. These recordings are ideal for calculating RMSSD and other metrics sensitive to parasympathetic tone. The short duration makes them practical for morning checks, pre-workout assessments, or post-meditation snapshots. Because the measurement window is brief, short-term HRV is less influenced by circadian rhythms or activity changes and can be repeated consistently under controlled conditions (same posture, same time of day, same breathing pattern). Most consumer wearables and apps use short-term windows, often during sleep or immediately upon waking.
Twenty-four-hour HRV monitoring, usually performed with a Holter monitor or continuous ECG recording, captures the full range of autonomic variability across sleep, activity, meals, stress, and rest. Long recordings are best suited for calculating SDNN and other metrics that reflect overall autonomic function and circadian patterns. Clinical research and cardiovascular risk assessment often rely on 24-hour HRV because it provides a more complete picture of autonomic health. But 24-hour monitoring is less practical for routine self-tracking and more sensitive to data quality, artifacts, and interruptions.
| Recording Type | Duration | Best Metrics | Typical Use |
|---|---|---|---|
| Short-term | 1–5 minutes | RMSSD, pNN50, HF power | Daily recovery tracking, pre-workout readiness, stress checks |
| Nocturnal | Full night (6–8 hours) | RMSSD, SDNN (sleep-specific), HF power | Sleep quality, recovery assessment, baseline establishment |
| 24-hour | Full day and night | SDNN, SDANN, triangular index | Clinical assessment, cardiovascular risk, research studies |
| Ultra-short | 10–60 seconds | Estimated RMSSD (device-dependent) | Quick checks, apps, real-time biofeedback |
HRV, Stress, and Recovery Applications

HRV is widely used to quantify physiological stress and track recovery because it responds rapidly to changes in autonomic balance. Acute stress, whether psychological (work deadline, conflict) or physical (intense exercise, sleep deprivation), triggers sympathetic activation and lowers HRV. Chronic stress keeps HRV suppressed over days or weeks, often before subjective symptoms become obvious. This early-warning quality makes HRV a practical tool for detecting overtraining, illness onset, or sustained mental strain. Athletes monitor HRV daily to guide training load, using lower-than-baseline readings as a signal to reduce intensity or add a recovery day.
Recovery states, by contrast, elevate HRV as the body shifts into parasympathetic dominance. Good sleep, rest days, relaxation practices, and adequate nutrition all support higher HRV. During intense exercise, HRV can drop to nearly zero as the sympathetic system takes full control. After the session, HRV gradually rebounds, and the speed and completeness of that rebound reflect recovery capacity. If HRV remains suppressed the next morning, it suggests incomplete recovery or accumulated fatigue.
HRV isn’t a magic number that tells you exactly what to do, but it provides an objective data point that can inform decisions when combined with subjective measures like mood, energy, sleep quality, and soreness. Tracking weekly averages and trends is more useful than reacting to single-day values, which can be noisy.
Training and daily-life indicators where HRV is useful:
- Detecting early signs of overtraining before performance drops or injury risk increases.
- Deciding whether to proceed with a planned high-intensity workout or substitute an easy session.
- Monitoring recovery after illness, travel, or major life stress.
- Evaluating the impact of sleep interventions, nutrition changes, or stress-management practices.
- Identifying patterns linked to work deadlines, relationship stress, or seasonal changes.
- Guiding periodization in training programs by tracking long-term autonomic adaptation.
HRV Health Implications and Risk Indicators

Lower HRV is consistently associated with higher cardiovascular risk, increased mortality, and greater likelihood of adverse events in population studies. People with chronic low HRV, even after adjusting for age and other risk factors, show elevated rates of heart disease, hypertension, diabetes, and stroke. HRV appears to capture something broader than traditional risk markers like cholesterol or blood pressure, reflecting overall autonomic dysfunction, inflammation, and reduced physiological resilience. In post-heart-attack patients, depressed HRV predicts worse outcomes and is used clinically to assess recovery and risk stratification.
HRV is also linked to mental health. Chronic anxiety, depression, and post-traumatic stress disorder are all associated with reduced HRV, likely due to sustained sympathetic dominance and reduced vagal tone. Some researchers view HRV as a physiological marker of emotional regulation capacity. Lower HRV correlates with higher inflammatory markers (such as C-reactive protein) and dysregulated hypothalamic-pituitary-adrenal (HPA) axis activity, suggesting that autonomic imbalance and systemic inflammation share common pathways.
It’s important to emphasize that HRV isn’t a diagnostic tool. It doesn’t tell you that you have a specific disease, and a single low reading doesn’t predict an imminent event. Instead, HRV is an informative biomarker that reflects autonomic health and can guide further investigation, lifestyle modification, or clinical follow-up when patterns are concerning.
Key research-backed associations with HRV:
- Cardiovascular disease: Lower HRV predicts higher risk of heart attack, arrhythmia, heart failure, and sudden cardiac death.
- Metabolic health: Reduced HRV is common in people with insulin resistance, type 2 diabetes, and obesity.
- Mental health: Anxiety, depression, and chronic stress are linked to persistently low HRV and reduced vagal tone.
- Inflammation: Low HRV correlates with elevated inflammatory markers and immune dysregulation.
- Longevity: Higher HRV in older adults is associated with better overall health and lower all-cause mortality.
Factors That Influence HRV and How to Control Them

Many factors affect HRV, some of which you can’t change and some of which are modifiable through behavior and environment. Age is the most significant non-modifiable influence. HRV generally declines with age, starting in early adulthood and continuing through later decades, reflecting natural reductions in autonomic flexibility and vagal tone. Genetics also play a major role, accounting for a substantial portion of baseline HRV variability between individuals. Hormonal cycles, particularly the menstrual cycle in women, influence HRV, with lower values often observed during the luteal phase. Chronic illnesses such as cardiovascular disease, diabetes, hypertension, and autoimmune conditions are associated with persistently lower HRV.
Modifiable factors include sleep quality and timing, hydration status, alcohol and caffeine intake, physical activity patterns, stress management, and environmental conditions. Poor sleep or sleep deprivation suppresses HRV by prolonging sympathetic activation and reducing parasympathetic recovery. Even one night of poor sleep can lower HRV measurably. Dehydration reduces blood volume and increases cardiovascular strain, which lowers HRV. Alcohol consumption, especially in the evening, disrupts sleep architecture and autonomic balance, often resulting in lower HRV overnight and into the next morning. Chronic psychological stress keeps the sympathetic system activated and prevents full autonomic recovery, leading to sustained low HRV over weeks or months.
Modifiable factors you can adjust to support HRV:
- Prioritize consistent, adequate sleep (7–9 hours for most adults) with good sleep hygiene and a regular schedule.
- Stay well-hydrated throughout the day; dehydration lowers HRV and impairs recovery.
- Limit alcohol, especially late in the evening; even moderate intake can suppress overnight HRV.
- Manage chronic stress through relaxation practices, time management, social support, and therapy when needed.
- Engage in regular moderate exercise with appropriate recovery; avoid chronic overtraining without rest days.
- Control environmental factors like temperature (cool sleeping environment), air quality, and altitude exposure when possible.
Improving HRV Through Evidence-Based Practices

Several interventions have been shown to increase HRV, primarily by enhancing parasympathetic tone and reducing sympathetic overactivity. Slow, controlled breathing is one of the most immediate and effective methods. Breathing at a rate of approximately 5 to 6 breaths per minute (roughly 5 seconds in, 5 seconds out) activates the vagus nerve, increases HF power, and raises RMSSD within minutes. This is the foundation of HRV biofeedback training and coherence breathing practices, which train the body to sustain higher autonomic flexibility over time. Regular practice, even just 5 to 10 minutes daily, can produce measurable improvements in baseline HRV within a few weeks.
Consistent aerobic exercise improves HRV over the long term by enhancing cardiovascular fitness, increasing vagal tone, and reducing resting heart rate. Meditation and mindfulness practices also raise HRV by lowering stress hormone levels and promoting parasympathetic dominance. Sleep optimization, including maintaining a regular sleep schedule, reducing screen time before bed, and creating a cool, dark sleep environment, supports overnight HRV recovery. Reducing alcohol intake and managing caffeine timing (avoiding late-day consumption) can improve HRV consistency and quality.
Five evidence-supported interventions to improve HRV:
- Practice slow, paced breathing at 5–6 breaths per minute for 5–10 minutes daily.
- Engage in regular moderate-intensity aerobic exercise (e.g., 30 minutes of brisk walking, cycling, or swimming most days).
- Establish a consistent sleep routine with 7–9 hours per night and good sleep hygiene.
- Reduce or eliminate alcohol, especially in the evening, to support overnight autonomic recovery.
- Incorporate stress-reduction practices such as meditation, mindfulness, yoga, or progressive muscle relaxation.
Interpreting HRV Trends and Individual Baselines
HRV is highly individual. Normative values published in research papers show wide ranges, from below 20 milliseconds to over 200 milliseconds in healthy adults, with population averages often clustering around 50 milliseconds for RMSSD. Age, sex, fitness level, genetics, and measurement method all influence these numbers. A 25-year-old endurance athlete may have a baseline RMSSD of 80 milliseconds, while a 55-year-old sedentary adult may have a baseline of 25 milliseconds, and both can be “normal” for their context. Single readings are nearly meaningless without comparison to an individual’s own baseline established over several weeks.
The most useful way to interpret HRV is to track your own trend over time. Measure HRV under consistent conditions (ideally during sleep or first thing in the morning, same posture, same device) and calculate weekly or monthly averages. Look for patterns relative to your baseline. A drop of 20 to 30 percent below your baseline for several consecutive days is a signal worth paying attention to, potentially indicating illness, overtraining, stress, or poor sleep. Short-term fluctuations (day-to-day changes of 10 to 20 percent) are normal and expected. Long-term improvements (rising baseline over weeks or months) suggest positive adaptation from training, lifestyle changes, or stress management.
| Interpretation Type | Time Scale | Primary Use |
|---|---|---|
| Single reading | One day | Limited value; useful only in extreme deviation or acute context |
| Weekly average | 7 days | Smooths daily noise; best for detecting meaningful trends and deviations |
| Monthly trend | 4 weeks or more | Tracks long-term adaptation, training response, lifestyle impact, and seasonal patterns |
Final Words
You learned HRV is the millisecond-level variation between heartbeats, how sympathetic and parasympathetic inputs change that variability, and why it shows autonomic flexibility rather than average heart rate.
The post covered key metrics (RMSSD, SDNN, LF/HF), measurement methods, short versus 24-hour recordings, and links to stress, recovery, and health risk.
If you still wonder what does heart rate variability measure, track brief resting readings over weeks and focus on sleep, slow breathing, and consistent activity. Small steady steps add up.
FAQ
Q: What is a good HRV for my age?
A: A good HRV for your age depends on measurement method and age; adult values commonly span about 20–200 ms and tend to decline with age—compare your personal baseline and age norms for useful context.
Q: Why don’t doctors look at HRV?
A: Doctors often don’t routinely check HRV because it’s variable, lacks standardized clinical thresholds, and devices differ; it’s a helpful biomarker but not yet part of most standard clinical workflows.
Q: What is an unhealthy HRV? Is it better to have a high HRV or low?
A: An unhealthy HRV is usually a persistently low value versus your baseline or age norms. Higher HRV typically means better autonomic flexibility; low HRV often signals stress, illness, or poor recovery.